Dataset: China-to-US Manufacturing Cost Deltas Across 20 Product Categories
April 23, 2026
Dataset: China-to-US Manufacturing Cost Deltas Across 20 Product Categories
As tariff regimes tighten and supply chain resilience becomes a board-level priority, US companies need hard numbers to evaluate whether reshoring or nearshoring makes financial sense. Quoted unit prices from Chinese factories rarely tell the full story — once you add duties, freight, tooling amortization, quality failures, and working capital costs, the delta between China and Americas-based production narrows substantially, and in many categories inverts entirely.
This dataset compiles landed-cost comparisons across 20 product categories based on aggregated quotations, customs data, and sourcing benchmarks gathered through early 2026. We at Reshore publish this data to help procurement teams, operations leaders, and founders make evidence-based sourcing decisions.
Methodology
The figures below represent blended averages drawn from three inputs: supplier quotes collected across the Reshore network, public trade data from the US International Trade Commission and US Census Bureau trade statistics, and landed-cost modeling using current Section 301 tariff rates as published by the Office of the US Trade Representative.
Each "Total Landed Cost" figure includes:
- Ex-works unit price from the manufacturer
- Ocean freight and drayage to a US Midwest destination
- Section 301 tariff (rates vary by HTS classification; most plastics categories sit at 7.5%–25%, with recent increases on select categories)
- Customs duties and MPF/HMF fees
- Tooling amortization spread across typical 3-year program volume
- Quality failure reserve (2%–6% depending on category)
- Inventory carrying cost reflecting the 35–60 day transit window
US costs reflect domestic contract manufacturing quotes across the Midwest, Southeast, and Texas corridor. For a deeper treatment of the invisible line items, see our Hidden Costs of Offshore Manufacturing breakdown.
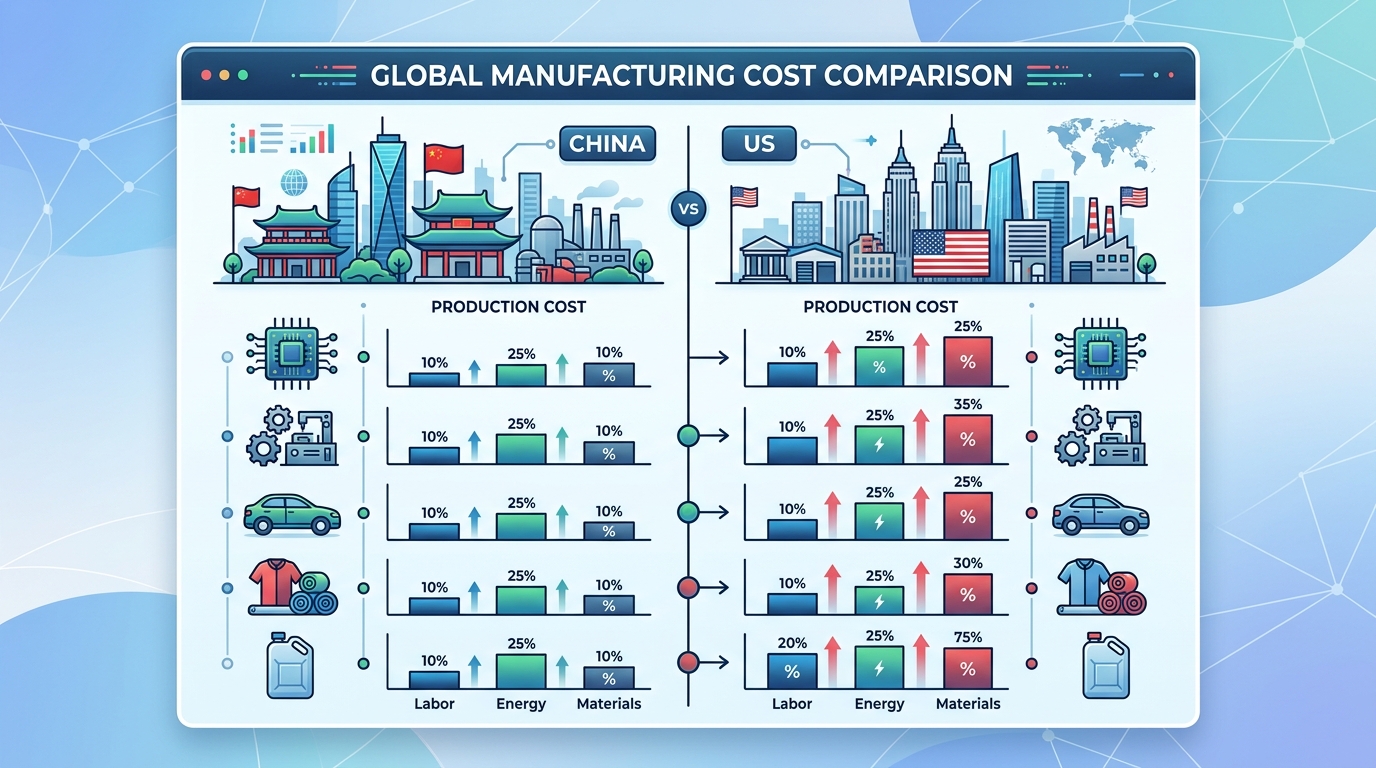
The 20-Category Cost Delta Table
All figures are per-unit landed cost in USD, normalized to a reference SKU within each category. Positive deltas indicate US is more expensive; negative deltas indicate the US has achieved cost parity or advantage after landed-cost adjustments.
| # | Product Category | China Ex-Works | China Total Landed | US Landed Cost | Delta (US − China) | % Delta |
|---|---|---|---|---|---|---|
| 1 | Injection-molded automotive clips | $0.18 | $0.34 | $0.36 | +$0.02 | +5.9% |
| 2 | PET beverage preforms | $0.042 | $0.071 | $0.068 | −$0.003 | −4.2% |
| 3 | Industrial pump housings (glass-filled nylon) | $8.40 | $13.10 | $12.85 | −$0.25 | −1.9% |
| 4 | Consumer electronics enclosures (ABS) | $1.15 | $1.98 | $2.34 | +$0.36 | +18.2% |
| 5 | Medical device housings (PC/ABS, Class II) | $4.60 | $7.25 | $7.40 | +$0.15 | +2.1% |
| 6 | HVAC plastic blower wheels | $2.30 | $3.85 | $3.70 | −$0.15 | −3.9% |
| 7 | Agricultural irrigation fittings (PP) | $0.64 | $1.12 | $0.98 | −$0.14 | −12.5% |
| 8 | Power tool housings (PA66) | $3.10 | $5.05 | $5.40 | +$0.35 | +6.9% |
| 9 | Food packaging containers (PP, IML) | $0.11 | $0.22 | $0.24 | +$0.02 | +9.1% |
| 10 | Appliance control panels (ABS overmold) | $2.85 | $4.60 | $4.95 | +$0.35 | +7.6% |
| 11 | Cosmetic closures and dispensing pumps | $0.28 | $0.51 | $0.58 | +$0.07 | +13.7% |
| 12 | Automotive interior trim (TPO) | $1.85 | $3.15 | $3.05 | −$0.10 | −3.2% |
| 13 | Electrical connector bodies (PBT) | $0.47 | $0.82 | $0.89 | +$0.07 | +8.5% |
| 14 | Toys and hobby components (ABS) | $0.95 | $1.72 | $2.45 | +$0.73 | +42.4% |
| 15 | Industrial pallets (HDPE structural) | $22.50 | $38.20 | $36.80 | −$1.40 | −3.7% |
| 16 | Lawn and garden equipment housings | $5.40 | $8.65 | $8.90 | +$0.25 | +2.9% |
| 17 | Plumbing fittings (PPR/CPVC) | $0.38 | $0.68 | $0.61 | −$0.07 | −10.3% |
| 18 | Point-of-purchase display components | $1.20 | $2.15 | $2.85 | +$0.70 | +32.6% |
| 19 | Aerospace interior plastics (PEI/ULTEM) | $14.20 | $22.50 | $21.80 | −$0.70 | −3.1% |
| 20 | Pet product housings (injection molded) | $1.75 | $3.05 | $3.25 | +$0.20 | +6.6% |
Key Findings
1. Industrial and heavy-duty categories favor the Americas
Categories 3, 7, 15, 17, and 19 — industrial pumps, irrigation fittings, HDPE pallets, plumbing fittings, and aerospace interiors — show US landed cost parity or advantage. These categories share three traits: high shipping density (weight-to-value), low labor content per unit, and moderate-to-high tariff exposure.
2. Highly labor-intensive consumer categories still favor China on unit cost — but the gap is shrinking
Toys (category 14) and POP displays (category 18) still show meaningful China advantage. These are typical China+1 candidates rather than full reshoring candidates in the near term. Our guide on China+1 vs. Full Reshoring strategy explores how to segment SKUs by this profile.
3. Medical, automotive, and industrial plastics cluster near parity
Categories 1, 3, 5, 6, 8, 12, 16, and 20 all sit within ±10% of parity. For these SKUs, the decision hinges on non-price factors: IP protection, lead time, qualification burden, and tariff volatility. Reshoring often wins when these are properly weighted.
4. The "China price" is not the China price
Across the dataset, tariffs, freight, and tooling amortization added an average of 72% on top of ex-works quotes. Procurement organizations benchmarking on ex-works alone routinely underestimate true cost by this margin.
Tariff Exposure by Category
Tariff rates are the single biggest variable in the landed-cost equation. The table below summarizes current Section 301 exposure for the plastics HTS codes most relevant to this dataset.
| HTS Chapter | Description | Typical Section 301 Rate |
|---|---|---|
| 3923 | Plastic packaging articles | 25% |
| 3926 | Other articles of plastic | 7.5%–25% |
| 8708 | Automotive parts (incl. plastic) | 25% |
| 9503 | Toys | 7.5% |
| 8414 | Fans and blowers (incl. plastic) | 25% |
Rates are subject to change; verify current classification and duty at the Harmonized Tariff Schedule before finalizing sourcing decisions.
How to Apply This Dataset
The deltas above are directional benchmarks, not a substitute for SKU-level analysis. A practical application workflow:
- Segment your SKU portfolio into the 20 categories (or closest adjacent).
- Identify candidates at or near parity as first-wave reshoring targets.
- Model your specific tooling transfer cost — this is typically the single largest one-time variable.
- Pressure-test against Mexico in addition to US. For many labor-weighted categories, Mexican manufacturing closes gaps that US production cannot. See our Mexico vs. China Manufacturing comparison for side-by-side metrics on cost, lead time, and quality.
- Factor in qualification cycles for regulated categories (medical, automotive, aerospace).
Reshore's platform automates steps 1–4 for plastic and injection-molded SKU portfolios. If you want to run your own portfolio against this dataset, you can start with a reshoring assessment that produces a prioritized relocation plan for your tooling and supplier base.
Caveats and Limitations
- Tariff volatility: Rates referenced reflect early 2026 conditions. Administrative actions can shift the deltas meaningfully within weeks.
- Volume sensitivity: Tooling amortization is highly volume-dependent. Very low-volume SKUs (<50k/year) skew against both geographies equally; very high-volume SKUs (>2M/year) magnify the China advantage in labor-intensive categories.
- Quality and IP risk are not fully priced: The 2%–6% quality reserve does not capture catastrophic events (tooling held hostage, IP duplication, warranty recalls). Organizations with prior negative experiences typically add 3%–8% to the China column as a risk-adjusted premium.
- Regional variation inside the US: Midwest rates used as baseline; Southeast and Texas trend 4%–8% lower; Pacific and Northeast trend 5%–12% higher.
Frequently Asked Questions
Q: How accurate is a China-to-US cost comparison based on ex-works pricing alone?
Ex-works pricing typically captures only 55%–60% of true landed cost for US buyers. Tariffs, freight, tooling amortization, quality reserves, and inventory carrying costs together add roughly 70%+ on top of the ex-works number. Any sourcing decision made on ex-works alone will systematically undervalue domestic and nearshore alternatives.
Q: Which product categories are the best candidates for reshoring today?
Categories with high shipping density, moderate labor content, and high tariff exposure are the clearest candidates — industrial pumps, HDPE pallets, plumbing fittings, irrigation components, and aerospace interiors all show landed-cost parity or US advantage in current data. Labor-dense consumer categories like toys and POP displays still favor offshore production on unit cost.
Q: What is the typical tariff rate on plastic products imported from China?
Most plastic products fall under HTS chapters 3923 and 3926, which carry Section 301 tariffs ranging from 7.5% to 25% depending on classification. Automotive and industrial plastics under other chapters (like 8708 or 8414) generally sit at 25%. Verify current rates through the USITC tariff database before modeling.
Q: How should I factor tooling transfer costs into a reshoring cost analysis?
Tooling transfer cost has three components: the transfer itself (logistics, rigging, customs), refurbishment or re-qualification at the receiving facility, and sampling/PPAP resubmission. For injection molds in good condition, budget $3,000–$8,000 for transfer logistics and $5,000–$20,000 for re-qualification sampling. Molds with significant wear may require $20,000–$60,000 in refurbishment. Include these one-time costs in your exit cost model alongside the ongoing tariff savings and freight reductions that accrue from the first month of Americas production — the payback period for most programs is 12–24 months.
Ready to get started? Request a reshoring assessment or run a cost comparison — we’ll respond within one business day.