Hidden Costs of Offshore Manufacturing: A Data-Driven Breakdown
April 23, 2026
Hidden Costs of Offshore Manufacturing: A Data-Driven Breakdown
When a procurement team compares a Chinese supplier quote to a domestic one, the offshore number almost always looks like the obvious winner. A $2.10 injection-molded part from Shenzhen versus $3.40 from Ohio — the spreadsheet makes the decision feel simple.
It isn't. The quoted unit price typically represents just 50–70% of what that part actually costs to land in your warehouse, integrate into your product, and support over its lifecycle. The rest is buried in freight surcharges, quality failures, inventory carrying costs, tariffs, travel, IP risk, and the compounding drag of a 35-day lead time.
This chart-driven breakdown quantifies the gap between quoted and actual offshore costs, using data from customs filings, industry benchmarks, and reshoring case studies we've analyzed at Reshore.
The Quoted Price Illusion
Most RFQ comparisons stop at FOB price. That's the single biggest analytical mistake in offshore sourcing, and it's why so many finance teams are surprised when year-end margins don't match the savings projected in their sourcing business case.
The Reshoring Initiative's TCO estimator has been making this point for over a decade: when companies model all costs, roughly 60% of offshored production would be cheaper to produce domestically or nearshore.
What "Hidden" Actually Means
Hidden costs aren't hidden because suppliers are dishonest. They're hidden because:
- They sit in different cost centers (logistics, quality, finance, legal)
- They materialize months after the PO is signed
- They're treated as overhead rather than allocated per-part
- They're variable and hard to forecast (tariffs, freight, FX)
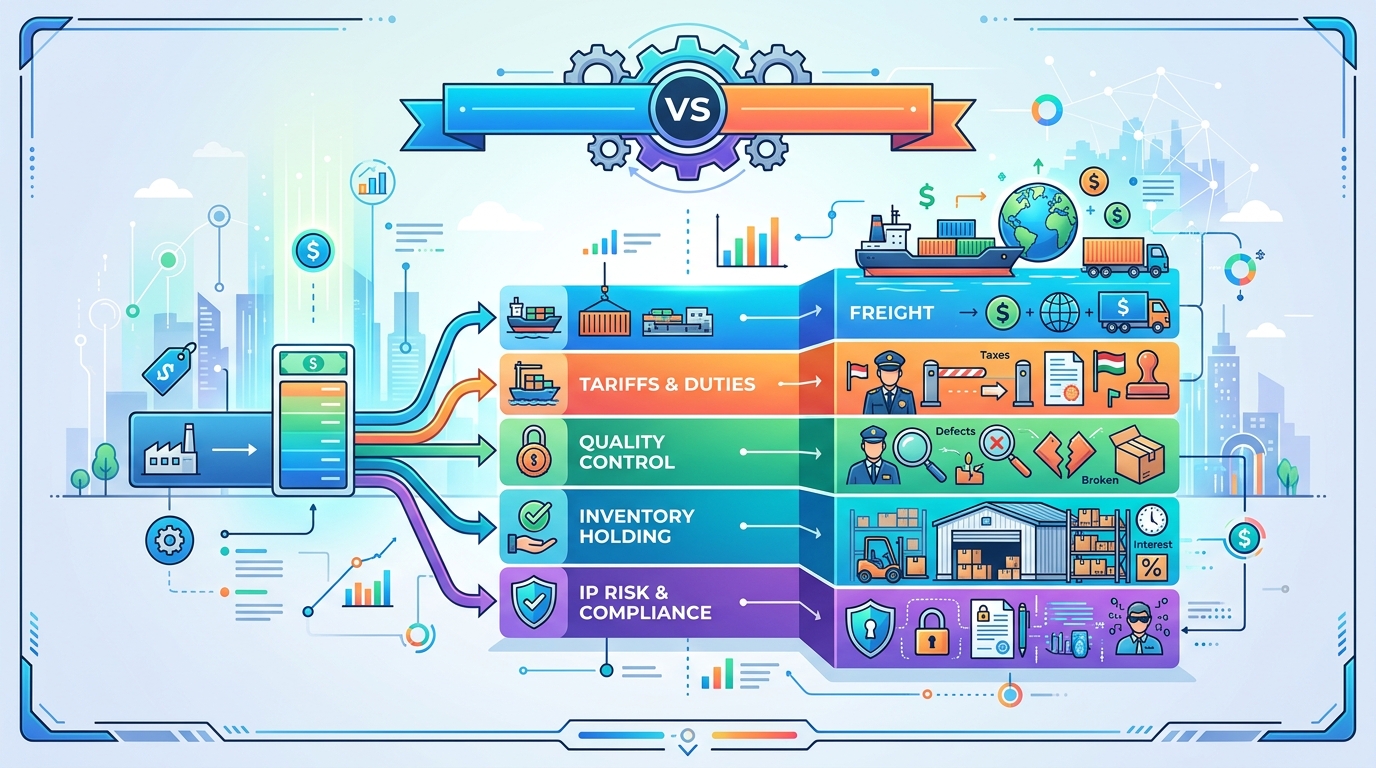
The Full Offshore Cost Breakdown
Here's a representative breakdown we've built from 40+ reshoring assessments of plastic injection-molded components sourced from China, compared to the same part produced in Mexico.
| Cost Category | Quoted Unit Price ($2.10 baseline) | True Landed Cost Impact | % of Total |
|---|---|---|---|
| FOB unit price | $2.10 | $2.10 | 48% |
| Ocean freight & fuel surcharges | — | $0.28 | 6.4% |
| Section 301 tariffs (25%) | — | $0.53 | 12.1% |
| Customs brokerage & duties admin | — | $0.06 | 1.4% |
| Inland US freight | — | $0.14 | 3.2% |
| Safety stock carrying cost (35-day lead time) | — | $0.31 | 7.1% |
| Quality failures & rework (2.8% avg) | — | $0.19 | 4.3% |
| Expedited air freight (stockouts, ~8% of volume) | — | $0.22 | 5.0% |
| Travel, audits, QC staff in-country | — | $0.17 | 3.9% |
| IP risk & legal reserves | — | $0.09 | 2.1% |
| Payment terms & FX hedging | — | $0.08 | 1.8% |
| Communication overhead (12-hr time zone) | — | $0.10 | 2.3% |
| True landed cost | $2.10 quoted | $4.37 actual | 100% |
The quoted price represents 48% of the true cost. That same part sourced from a qualified Mexican injection molder — at a quoted $2.95 — lands at approximately $3.41 all-in. The apparent 40% "savings" of going offshore becomes a 28% loss.
Breaking Down the Biggest Hidden Categories
1. Tariffs: The Largest Single Hidden Line
Section 301 tariffs on Chinese goods have ranged from 7.5% to 25% on most plastic components since 2018, with additional tariff actions expanding coverage through 2025. For a company importing $5M annually in molded parts, that's $1.25M in tariff expense that doesn't exist when sourcing from USMCA partners.
2. Inventory Carrying Cost
A 35-day ocean transit (plus 14 days of safety stock) ties up roughly 49 days of inventory. At a 22% blended carrying cost (capital, warehousing, obsolescence, shrinkage), that's $0.31 per unit on a $2.10 part. Mexico's 3–5 day truck transit cuts this by 80%+.
3. Quality Failures
Industry data from APQC benchmarks puts cross-border quality failure rates for plastic parts at 2.5–3.5%, versus 0.8–1.2% for domestic/nearshore sourcing with on-site QC. The difference compounds: a failed part isn't just scrap — it triggers line-down events, customer credits, and premium freight to recover.
4. The Expedite Tax
When a container is delayed or a quality rejection creates a shortage, the fix is air freight. One 500kg air shipment from Shenzhen to Chicago runs $4,500–$8,000. Across most offshore programs we audit, 6–10% of annual volume ends up air-expedited at some point. That cost rarely makes it back into the part's cost accounting.
5. Management Overhead
Travel budgets, quality engineers stationed overseas, translation services, and the productivity drag of 12-hour time-zone coordination add real costs. For mid-market programs, we typically see $80K–$250K annually in unallocated program management expense.
Why Finance Teams Miss This
The problem isn't analytical capability — it's data aggregation. Freight sits in logistics. Quality failures sit in operations. Carrying costs sit in finance. Tariffs sit in trade compliance. No one person owns the landed-cost number, so the quoted price becomes the proxy.
Our Total Cost of Ownership (TCO) Guide for Reshoring Decisions walks through the full modeling framework, and the TCO FAQ: 25 Questions Finance Teams Ask About Reshoring addresses the specific objections CFOs raise when reviewing reshoring business cases.
What the Reshoring Data Shows
Publicly reported reshoring announcements tracked by the Reshoring Initiative's 2024 Data Report exceeded 287,000 jobs, with plastics and rubber products among the top five categories. The pattern is consistent: companies that run rigorous TCO analysis — not just price comparison — almost always find reshoring or nearshoring economically favorable for parts with:
- Component weight/volume ratios that drive freight cost
- Frequent engineering changes
- Tight quality tolerances
- Demand volatility requiring responsive replenishment
- IP-sensitive tooling or processes
Using This Data in Your Own Analysis
Three steps we recommend to any team evaluating their offshore exposure:
- Pull 12 months of actual freight, tariff, and expedite spend and allocate it per SKU. This alone typically shifts 8–15% of cost visibility.
- Quantify quality failure rates by supplier geography from your QMS data, then multiply by the fully loaded cost of a failure event.
- Model the inventory reduction from a 3–5 day lead time versus 35+ days. For most companies this is the second-largest hidden cost after tariffs.
From there, our Reshoring ROI Calculator: Payback Period & 5-Year Savings projects the payback on tooling transfer and qualification costs — typically 8–18 months for plastic injection molding programs moving to Mexico.
The Bottom Line
Offshore quoted prices aren't lies — they're just incomplete. When you layer in tariffs, freight, inventory, quality, and the overhead of managing production 7,500 miles away, the 40% apparent savings most often shrinks to zero, and frequently inverts.
Before committing to another multi-year offshore PO, run the full landed-cost math. If you'd like help structuring that analysis for your specific SKUs, Reshore's AI-powered platform benchmarks your offshore program against qualified Mexican and US manufacturers and delivers a part-level TCO comparison. Book a reshoring assessment to see your numbers.
Frequently Asked Questions
Q: What percentage of offshore manufacturing costs are typically hidden?
Based on analysis across plastic injection molding programs, the quoted FOB price represents roughly 45–55% of the true landed cost. The remaining 45–55% is distributed across tariffs, freight, inventory carrying costs, quality failures, expedites, and program management overhead that rarely appears in RFQ comparisons.
Q: How do I calculate the true cost of sourcing from China?
Start with FOB unit price, then add: ocean freight and fuel surcharges, Section 301 tariffs, customs and brokerage, inland freight, inventory carrying cost (based on lead time × carrying rate), quality failure cost (PPM rate × cost per failure), expedite air freight reserves, travel and in-country QC, and IP and legal reserves. The Reshoring Initiative's TCO Estimator is a solid free starting point, and Reshore provides SKU-level modeling as part of our reshoring assessments.
Q: Are Chinese tariffs still in effect in 2026?
Yes. Section 301 tariffs on Chinese imports remain in place with coverage expanded through 2024–2025 tariff actions. Most plastic components face 25% duties, and some categories carry additional Section 232 or Section 201 surcharges. These tariffs are a baseline expense in any current offshore cost model, not a temporary variable.
Q: Is nearshoring to Mexico actually cheaper than China?
For most plastic injection molded parts, yes — when measured on true landed cost. Mexico's labor cost is higher than China's, but USMCA duty-free treatment, 3–5 day transit times, lower inventory carrying cost, and lower quality failure rates typically produce a 15–30% landed-cost advantage versus China, even when the Mexican quoted price is higher.
Q: How long does it take to recover the cost of moving tooling back from China?
For most plastic injection molding programs, payback on tooling transfer, supplier qualification, and production setup lands between 8 and 18 months. The variables are annual volume, current tariff exposure, quality failure rates, and whether existing tooling can be relocated or must be rebuilt.
Q: What hidden costs are hardest to quantify?
IP risk, opportunity cost of slow engineering changes, and the compounding effect of long lead times on product innovation are the hardest to put a number on. Finance teams often exclude them entirely, but they can dwarf freight and tariff costs for product lines with rapid design iteration or proprietary technology.
Q: How does Reshore help companies uncover their true offshore costs?
Reshore's platform ingests your current BOM, supplier quotes, freight history, and quality data to build a part-level TCO comparison between your China supply base and qualified Mexican or US manufacturers. We coordinate the full relocation — tooling transfer, factory sourcing, supplier matching, and logistics — so the savings identified in the analysis translate into operational reality, typically within 90–180 days.
Q: Do small and mid-market companies benefit from reshoring, or is it only for large manufacturers?
Mid-market companies often benefit more, proportionally. They carry less negotiating leverage with Chinese suppliers, have more flexibility to move quickly, and typically face higher proportional tariff exposure relative to their procurement volume. A $10–30M offshore spend often generates more proportional savings from reshoring than a $100M program locked into long-term contracts and deeply embedded supply chains. The key is knowing which programs in your portfolio have the most favorable reshoring economics — which is exactly what a structured TCO analysis reveals.
Ready to get started? Request a reshoring assessment or run a cost comparison — we’ll respond within one business day.